
Interactive Maps - Introduction to Leaflet
In today’s world, maps play a crucial role in visualizing information and aiding navigation. Whether we are developing a website, mobile application, or simply want to embed an interactive map on our blog, Leaflet is a powerful tool that can help us to achieve just that. In this blog post, we will walk through all the necessary steps to set up Leaflet gradually. By the end of the blog, we will have a fully functional interactive map desired.
Why Leaflet?
Leaflet is an open-source JavaScript library designed for creating interactive maps. It is lightweight weighing just about 42KB of JS, easy to use, and highly customizable, making it a popular choice for developers and designers alike. Leaflet provides a simple and intuitive API for embedding maps into web pages, and its modular structure allows users to extend its functionality through various plugins. As stated by Leaflet itself, the library is crafted with simplicity, performance, and usability in mind, and I can attest to that based on my experience using it.
Essential prep work for our Map
To begin our Leaflet journey, the first step is to include the Leaflet library in our project. We can either download the library and host it locally or include it directly from a Content Delivery Network (CDN). In the examples below, I have used the latter.
Once included, we are ready to create our first map.
CSS File
We will include the Leaflet CSS file to the head of the document.
  <link rel="stylesheet" href="https://unpkg.com/leaflet@1.9.4/dist/leaflet.css"
    integrity="sha256-p4NxAoJBhIIN+hmNHrzRCf9tD/miZyoHS5obTRR9BMY="
    crossorigin=""/>
JS File
We will include the Leaflet JS file and ensure that it is added after the Leaflet CSS file.
  <script src="https://unpkg.com/leaflet@1.9.4/dist/leaflet.js"
    integrity="sha256-20nQCchB9co0qIjJZRGuk2/Z9VM+kNiyxNV1lvTlZBo="
    crossorigin=""></script>
Div Element and Defining Height
Now, we need to add the div element where we want to display the map and define its height.
<div id="map" style="height: 180px;"></div>
Creating Our First Map
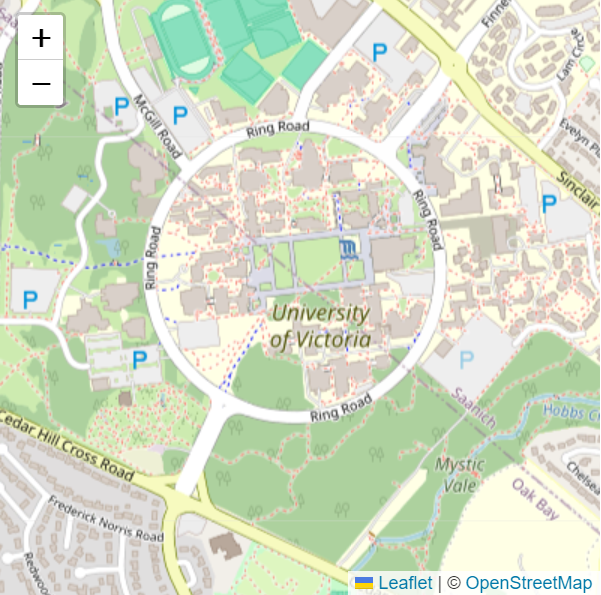
Now that we have Leaflet set up, let’s create a basic map centered at the University of Victoria using OpenStreetMap tiles. We can initialize the map by setting its view to our desired location, which in our case is the university. We will set the zoom level to 15, which is equivalent to viewing the Earth from a low-flying aircraft. By default, without passing any options during the map instance creation, all mouse and touch interactions on the map are enabled, and it includes zoom and attribution controls.
let map = L.map('map').setView([48.4626, -123.312], 15);
Moving forward, we will add a tile layer to enhance our map. In this example, we are incorporating an OpenStreetMap tile layer. The creation of a tile layer typically involves specifying the URL template for tile images, attribution text, and the maximum zoom level of the layer.
L.tileLayer('https://tile.openstreetmap.org/{z}/{x}/{y}.png', {
maxZoom: 19,
attribution: '© <a href="http://www.openstreetmap.org/copyright">OpenStreetMap</a>'
}).addTo(map);
Enhancing Our Leaflet Map: Markers, Circles, and Polygons
Now that we have laid the foundation for our Leaflet map, let’s explore how to elevate its visual appeal by adding markers, circles, and polygons.
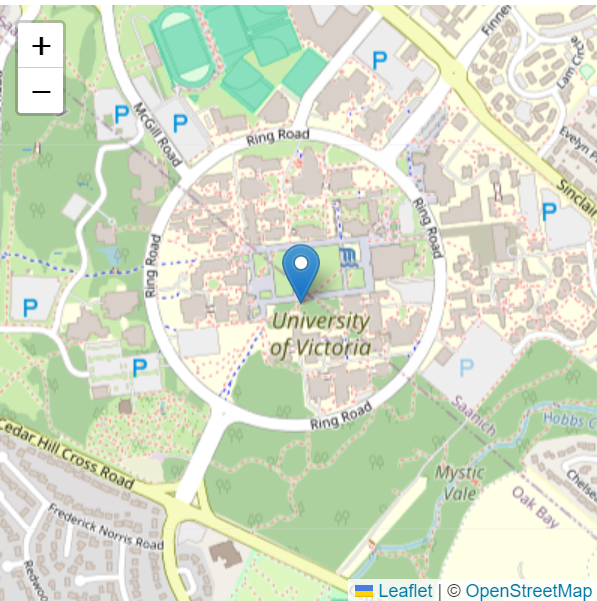
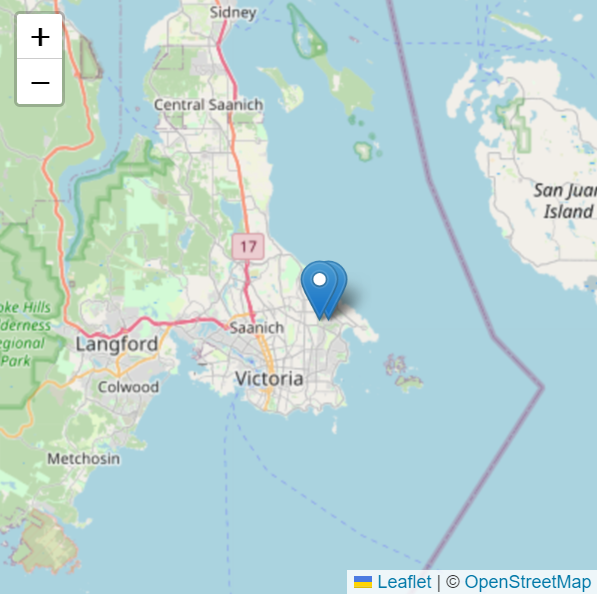
Marker
Let’s start by adding a marker to our map.
let marker = L.marker([48.4626, -123.312]).addTo(map);
Circle
Adding a circle follows a similar pattern, with the ability to customize its appearance by specifying options during creation. In this example, the circle is adorned with a red border, a fill color of red, and a fill opacity of 0.5. We can easily adjust these parameters to suit our map’s aesthetics.
  let circle = L.circle([48.4626, -123.312], {
    color: 'red',
    fillColor: 'red',
    fillOpacity: 0.5,
    radius: 50
  }).addTo(map);

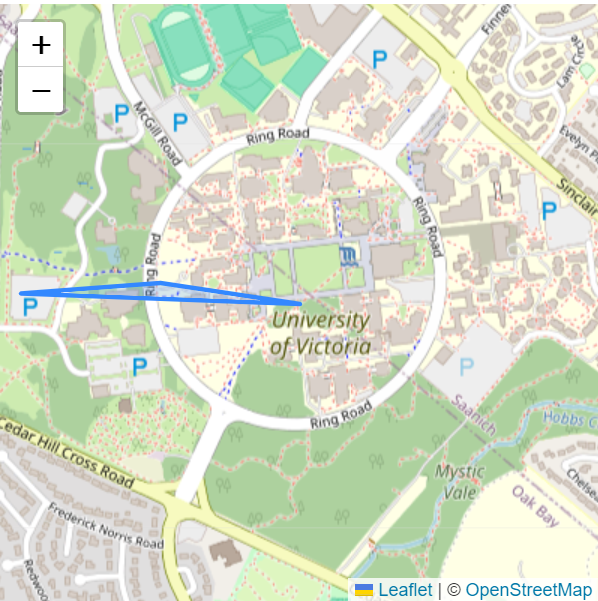
Polygon
Now, let’s incorporate a polygon into our map effortlessly.
  let polygon = L.polygon([
    [48.4626, -123.312],
    [48.4628, -123.320],
    [48.4630, -123.316]
  ]).addTo(map);
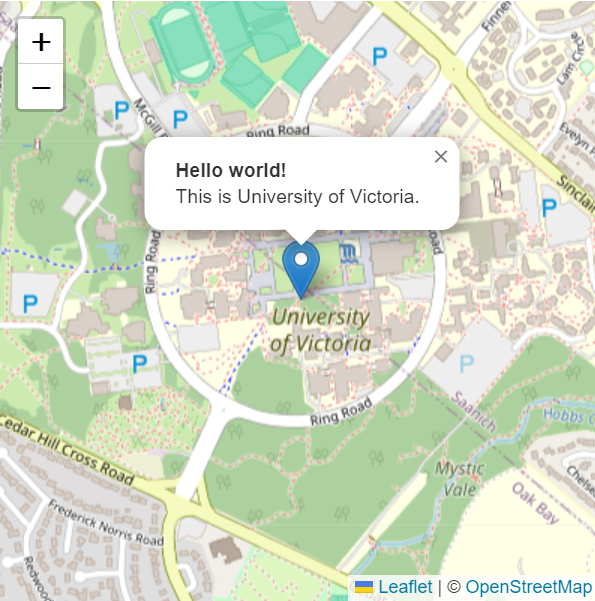
Popups with Leaflet
Let’s uncover the power of popups — a valuable tool when you want to associate information with specific objects on your map. Leaflet streamlines this process with a convenient shortcut.
  // Adds the popup functionality to the marker.

  //This popup only shows up when marker is clicked.
  marker.bindPopup("<b>Hello world!</b><br>This is University of Victoria.");

  //This popup will shows up by default when the map loads.
  marker.bindPopup("<b>Hello world!</b><br>This is University of Victoria.").openPopup();
Simply clicking on these objects reveals the attached popups. The bindPopup() method efficiently attaches a popup with specified HTML content to the object. The openPopup method ensures that the attached popup immediately opens as the map loads.
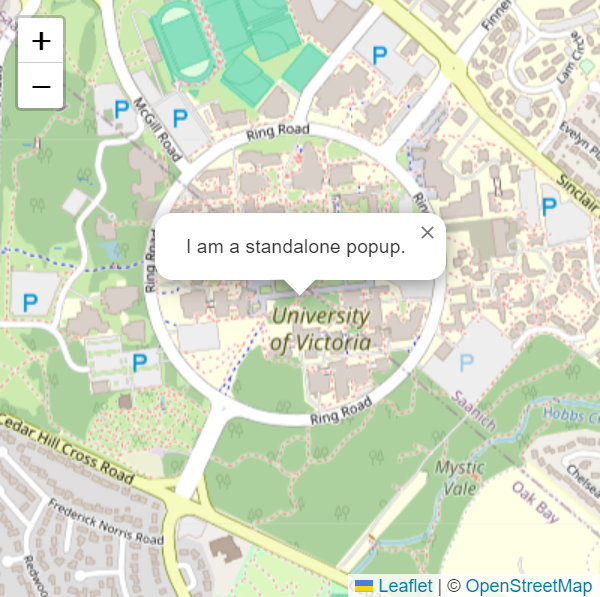
Popups as Standalone Layers
In this instance, we utilize openOn instead of addTo. This choice facilitates the automatic closure of any previously opened popup when a new one is initiated, enhancing the overall usability of your map.
  let popup = L.popup()
    .setLatLng([48.4626, -123.312])
    .setContent("I am a standalone popup.")
    .openOn(map);
Handling Events with Leaflet
In the dynamic world of Leaflet maps, responsiveness to user actions is important. Leaflet facilitates this by triggering events every time a significant action occurs, be it a user clicking on a marker or a change in map zoom. These events can be used to invoke functions. Here is a simple example.
  function onMapClick(e) {
      alert("You clicked the map at " + e.latlng);
  }

  map.on('click', onMapClick);
In this scenario, the onMapClick function is executed whenever a user clicks on the map. The e object passed to the function contains valuable information about the event, such as the geographical coordinates (latlng) of the click.
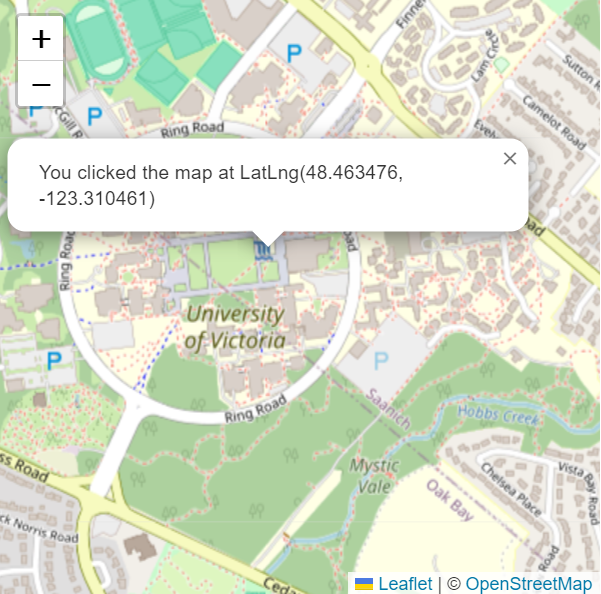
To enhance our example, let’s replace the basic alert with a more user-friendly popup.
  function onMapClick(e) {
    L.popup()
      .setLatLng(e.latlng)
      .setContent("You clicked the map at " + e.latlng)
      .openOn(map);
  }

  map.on('click', onMapClick);
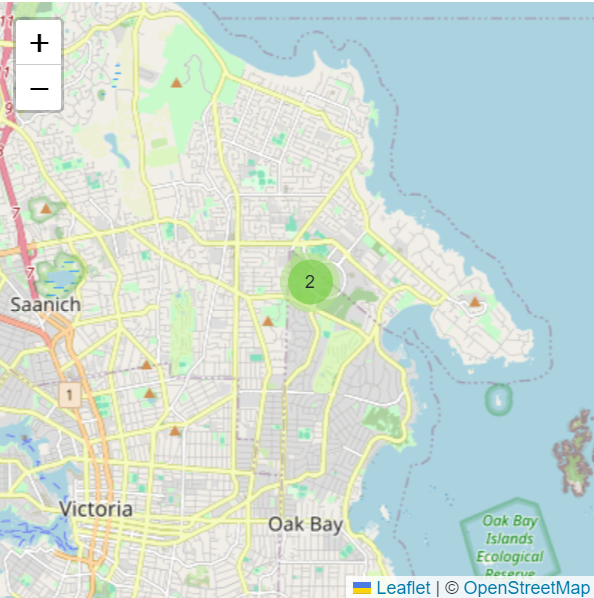
Map Clustering with Leaflet
When dealing with a large number of markers, clustering ensures a clean and organized display, providing users with a seamless and intuitive experience. To implement map clustering, we can leverage the Leaflet.markercluster plugin. Just like Leaflet, we integrate the plugin into our project through downloading it from here or incorporating it via CDN.
  // CSS
  <link rel="stylesheet" href="https://unpkg.com/leaflet.markercluster@1.4.1/dist/MarkerCluster.css" />
  <link rel="stylesheet" href="https://unpkg.com/leaflet.markercluster@1.4.1/dist/MarkerCluster.Default.css" />

  // JS
  <script src="https://unpkg.com/leaflet.markercluster@1.4.1/dist/leaflet.markercluster.js"></script>
Before adding the plugin, we have markers like this which can easily be messy as the number grows.
  L.marker([48.4626, -123.312]).addTo(map);
  L.marker([48.4626, -123.320]).addTo(map);
After integrating the plugin, we can modify our code to include clustering. Markers are grouped into clusters based on the zoom level.
  // Create a marker cluster group
  let markers = L.markerClusterGroup();

  // Add individual markers to the cluster group
  let marker1 = L.marker([48.4626, -123.312]);
  let marker2 = L.marker([48.4626, -123.320]);

  markers.addLayer(marker1);
  markers.addLayer(marker2);

  // Add the marker cluster group to the map
  map.addLayer(markers);
Final Thoughts
This exploration into Leaflet maps merely scratches the surface, offering a robust starting point. As you delve deeper into the world of Leaflet, there’s a wealth of advanced features and best practices awaiting your discovery, promising to elevate your map creation skills and enhance user experiences.
Here’s to the exciting journey ahead! 🌍🗺️